Visualizing your Data
Using Amazon QuickSight for the first time
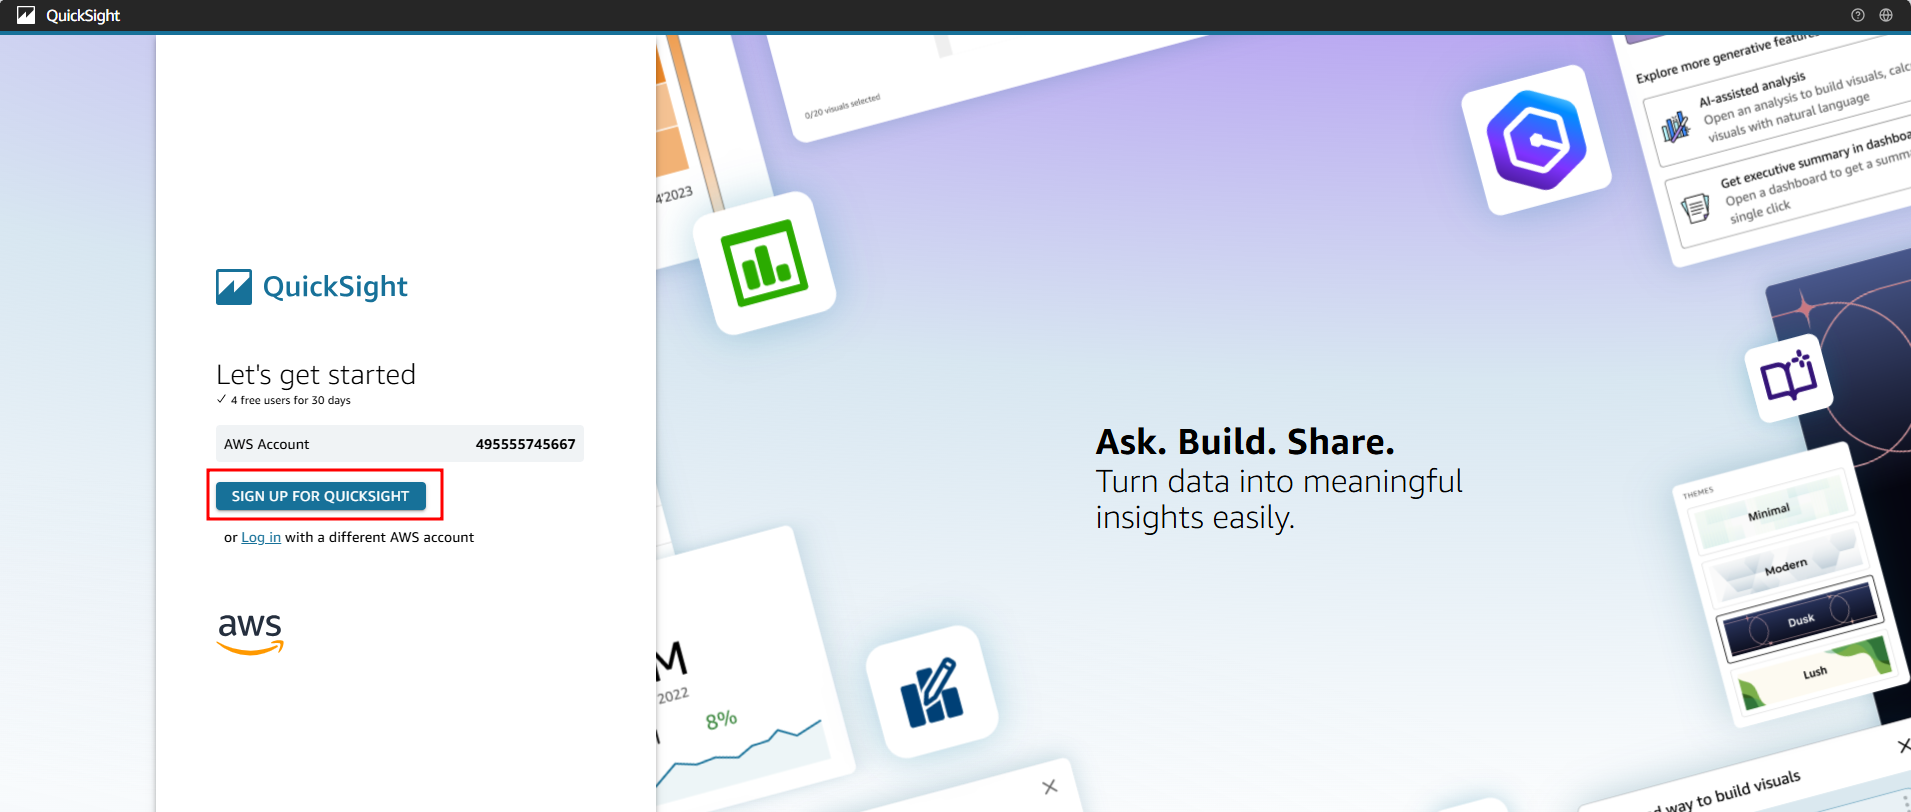
Go to QuickSight console, click Sign up for QuickSight.
On the Create your QuickSight account page, specify the following
- QuickSight account name
- Notification email address
- Authentication method

Choose your exist IAM role
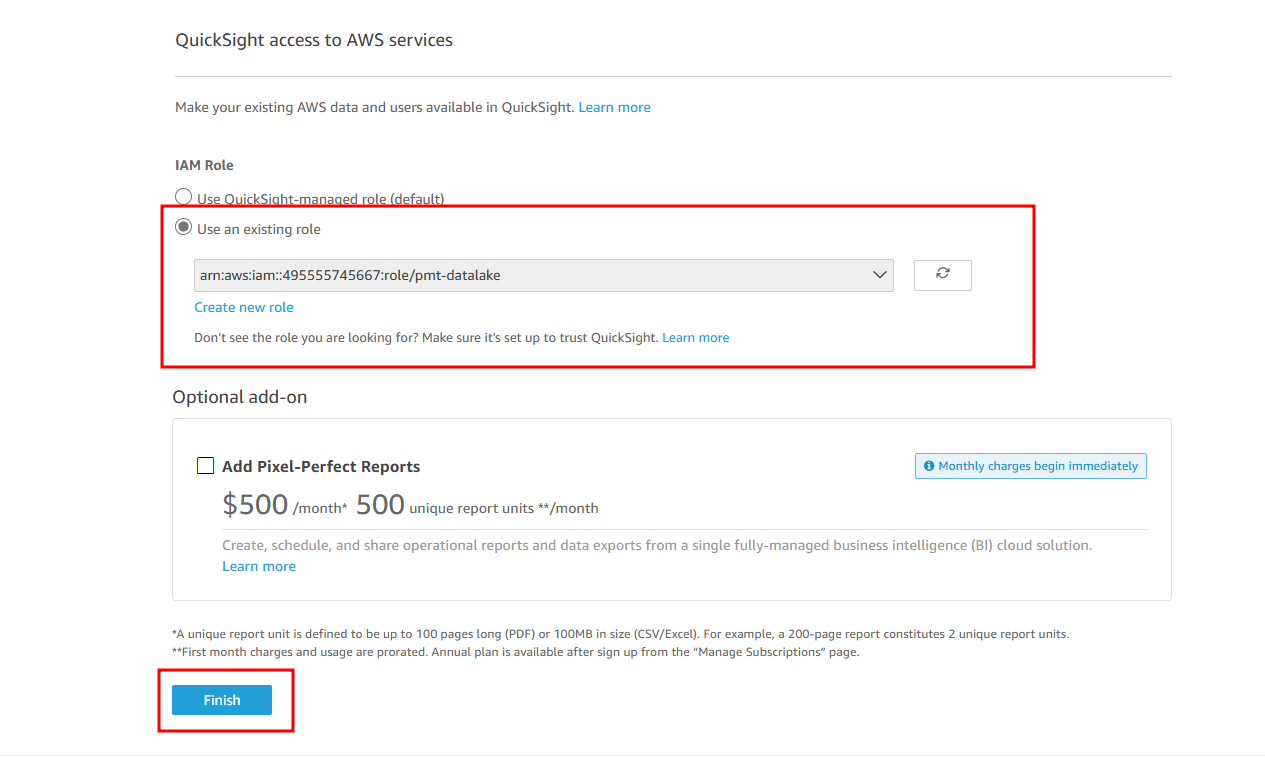
On the Create your QuickSight account page, click Finish
Connect to a data source
On the QuickSight page, click Datasets in the left navigation menu pane.
On the upper right section of the screen, click new dataset
Select Athena
In the New Athena data source window, specify the following:
- Data source name
- Athena workgroup – primary
- Click Create Data Source

In the Choose your table window, specify the following:
- Catalog – AwsDataCatalog
- Database
- Tables – v_yellow_tripdata

In the Finish dataset creation window, specify the following:
Import to SPICE for quicker analytics

Visualize your data
QuickSight will attempt to load your data to SPICE, please wait for a few minutes.
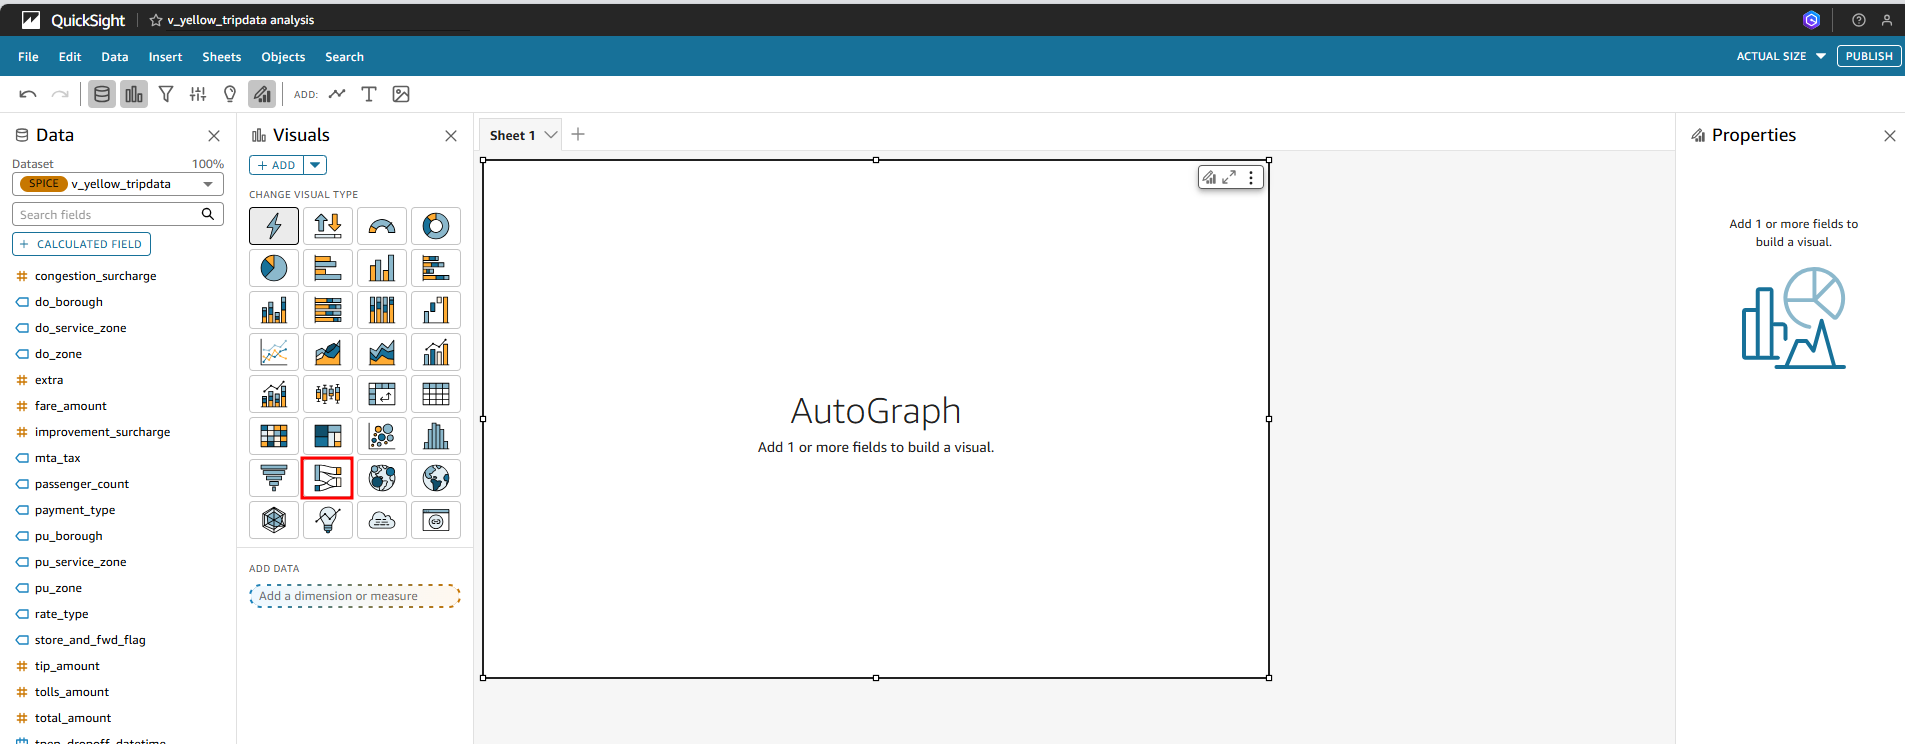
To visualize the flow of yellow taxi trips from pickup borough to drop-off borough, click + Add in the menu.
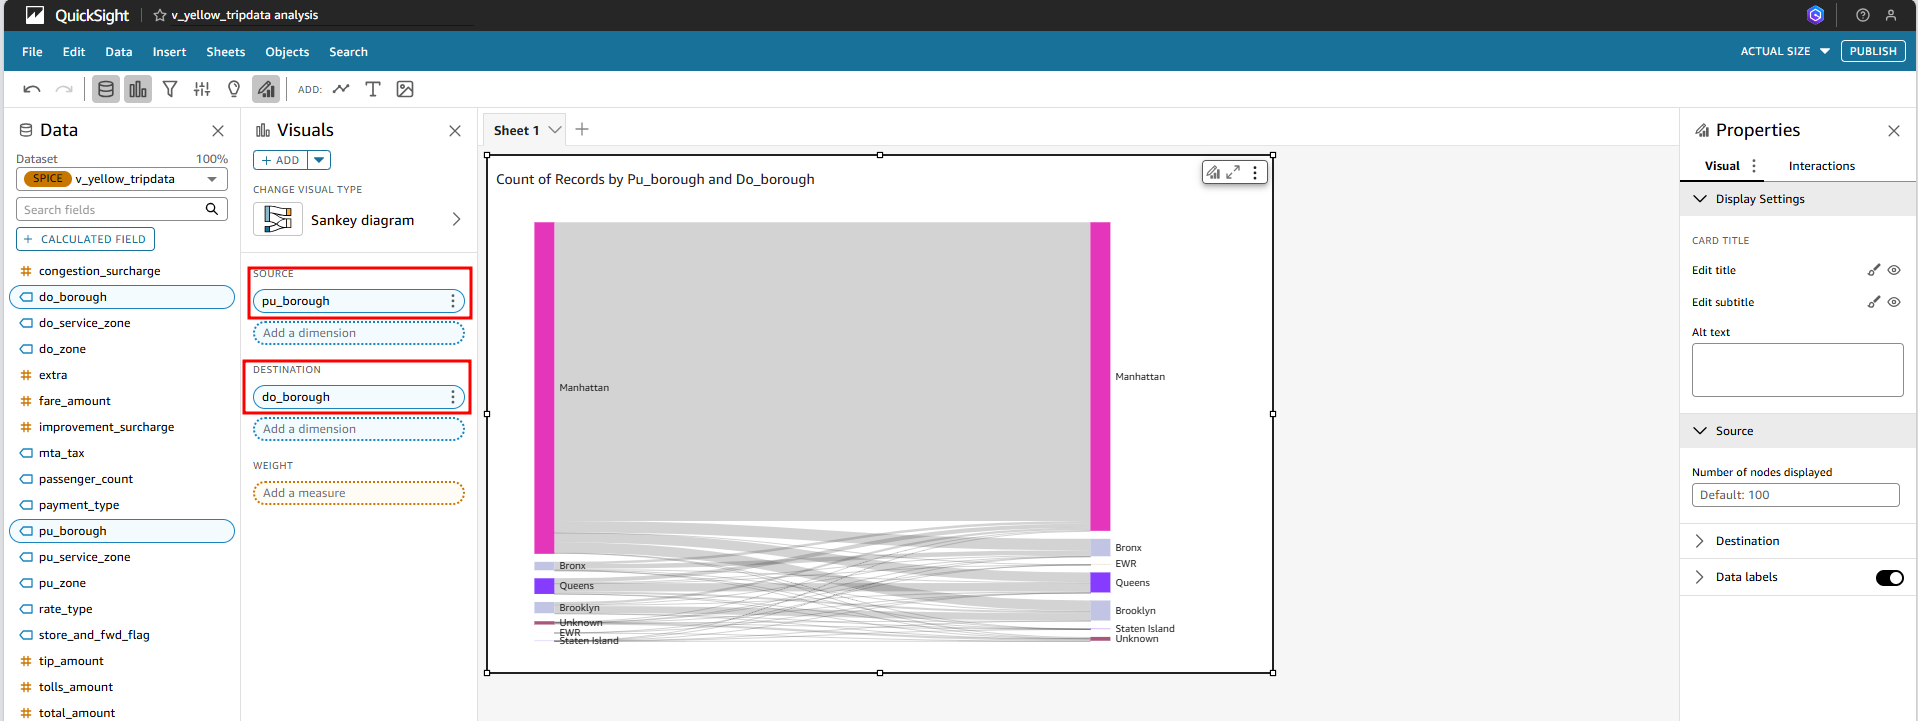
Select the Sankey visual type, specify the following on the Field wells.
- Source – pu_borough
- Destination – do_borough
- You can click on the visual type title, change it to Taxi Trips Flow
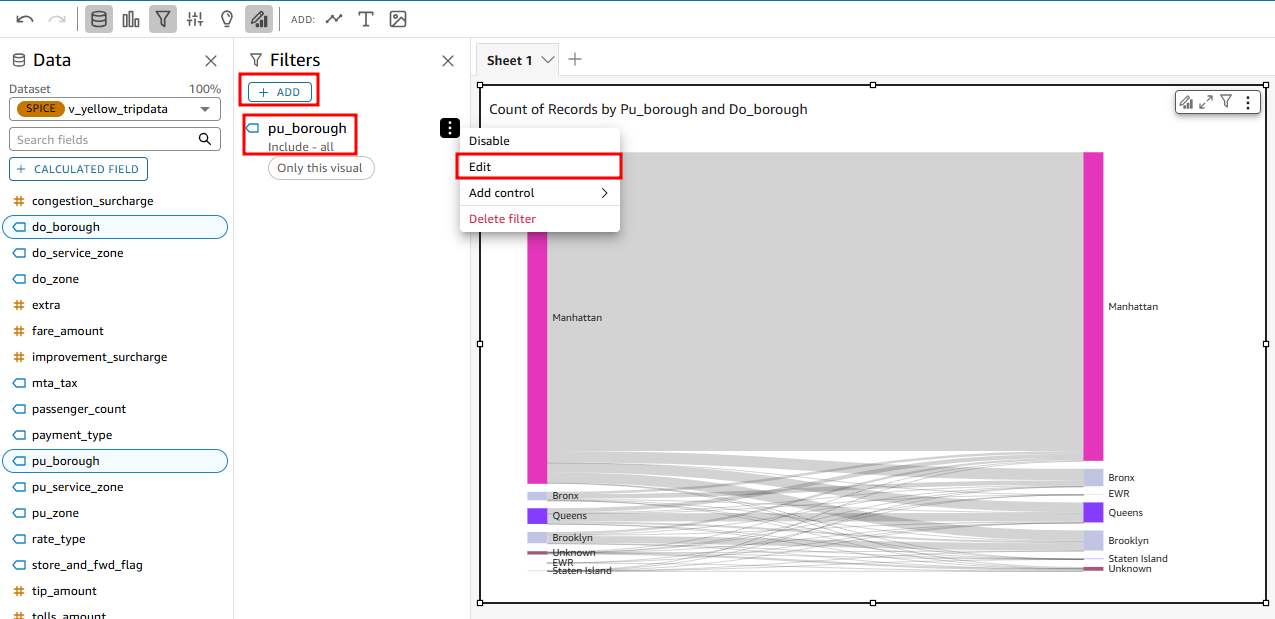
Filtering Data
Create a filter focus on taxi trips originating from Manhattan.
Type pu_borough and then select it.
Click on the menu besides the pu_borough filter, select Edit.
Deselect Manhattan from the Filter list, click Apply.

Get insights by examining the taxi trip flow based on pickup borough and drop-off borough.
Observe the traffic flow patterns.